AIO Indicator - How to use AIO BOT

AIO Indicator — How to use AIO BOT
Disclaimer
Before we share the details of how we use the AIO BOT for daily trading, we want to emphasize that trading is a risky way to make money. You can completely lose all the money you use for trading if the trading method and risk management are not effective. Trade only with the amount you are prepared to lose entirely. The trades you execute are your personal responsibility, and we do not take responsibility for any losses you incur.
AIO BOT Overview
https://aioindicator.com/
This is an indicator that we have developed to provide signals, indicating whether you should buy or sell at that moment. You can get a free-trial to verify the performance by yourself.
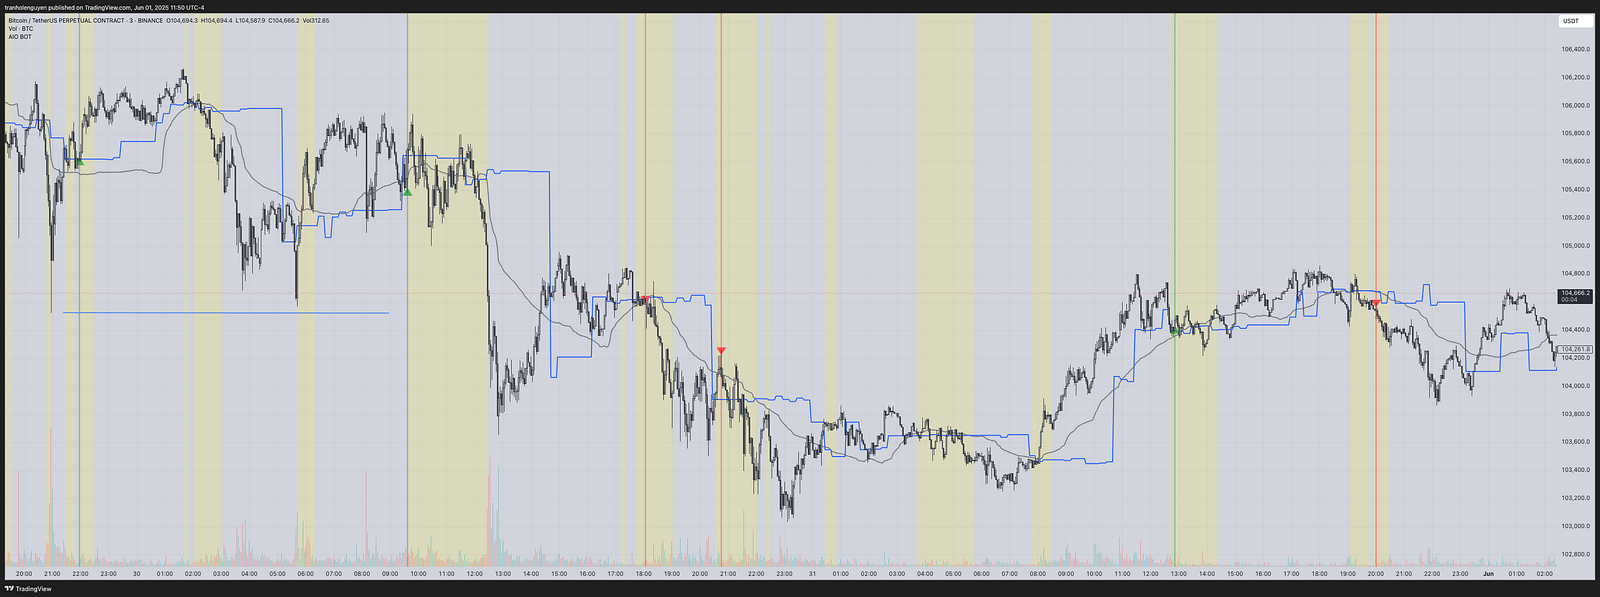
In general, AIO BOT is built based on the VWAP and the volume of price movement, which is shown through three main lines on the chart:
The VWAP is represented by a gray-colored line by default.
The pink line is the key volume line for the Main Timeframe, which is colored pink by default.
The blue line is the key volume line for the Higher Timeframe, which is colored blue by default.
Additionally, there are some coding logics that we use to determine the signal candles like: convergence threshold (% of ATR) and pivot to filter good signals.
Originally, we built this BOT to trade crypto, specifically the BTCUSDT pair. It is designed for intraday trading. Therefore, the backtest results and settings are centered around BTCUSDT and are short trades that end within the day.
Symbol: BTCUSDT
Main Timeframe: 3m
Higher Timeframe: 15m
If you use AIO BOT to trade other symbols or the other timeframes, you may need to adjust the settings to suit the symbol you’re trading.
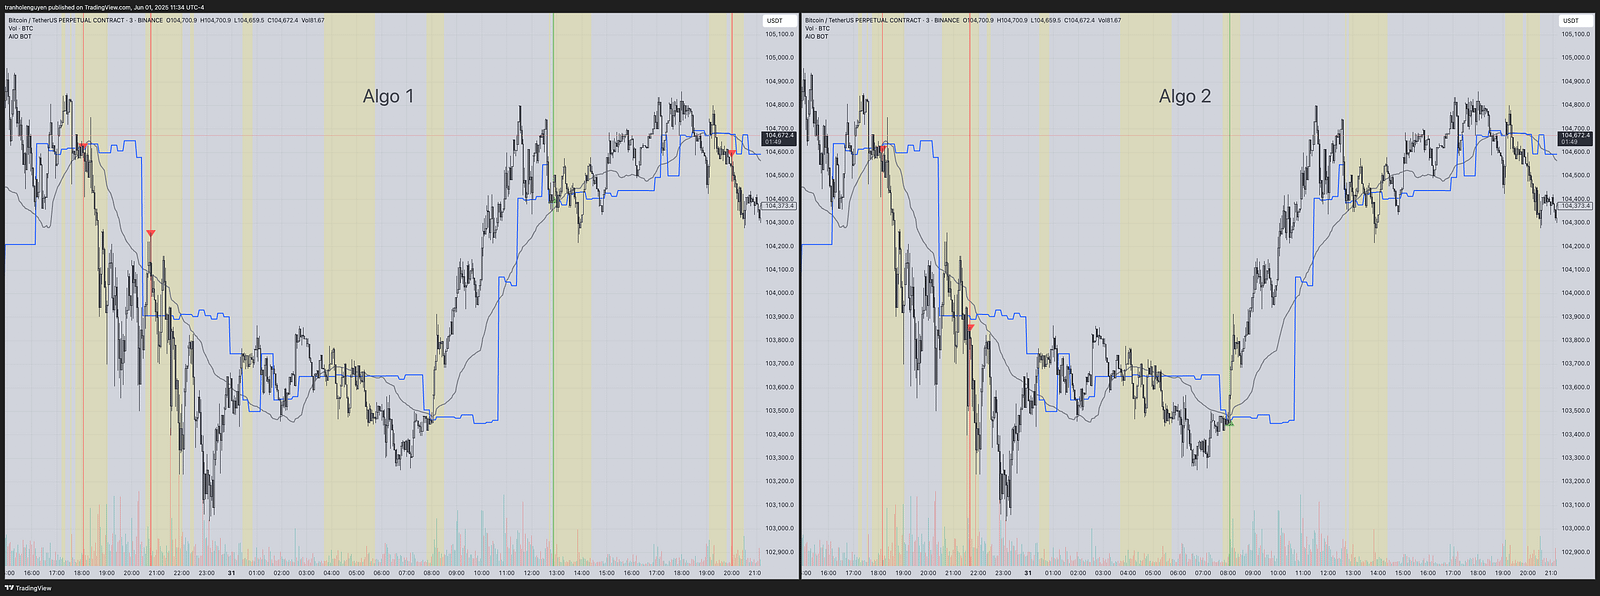
BOT Algos
There are 2 algorithms for signal detection. You can choose which algorithm best suits your symbol/trading style. You can also choose to display all signals of both algorithms
Algo 1: ON by default. This algorithm is built on the basis of the Key Volume Candles, VWAP, Pivot, Candlestick structure
Algo 2: OFF by default. This algorithm focuses more on how the candle reacts to these zones. This is a more aggressive algorithm, providing more signals and with higher risk.
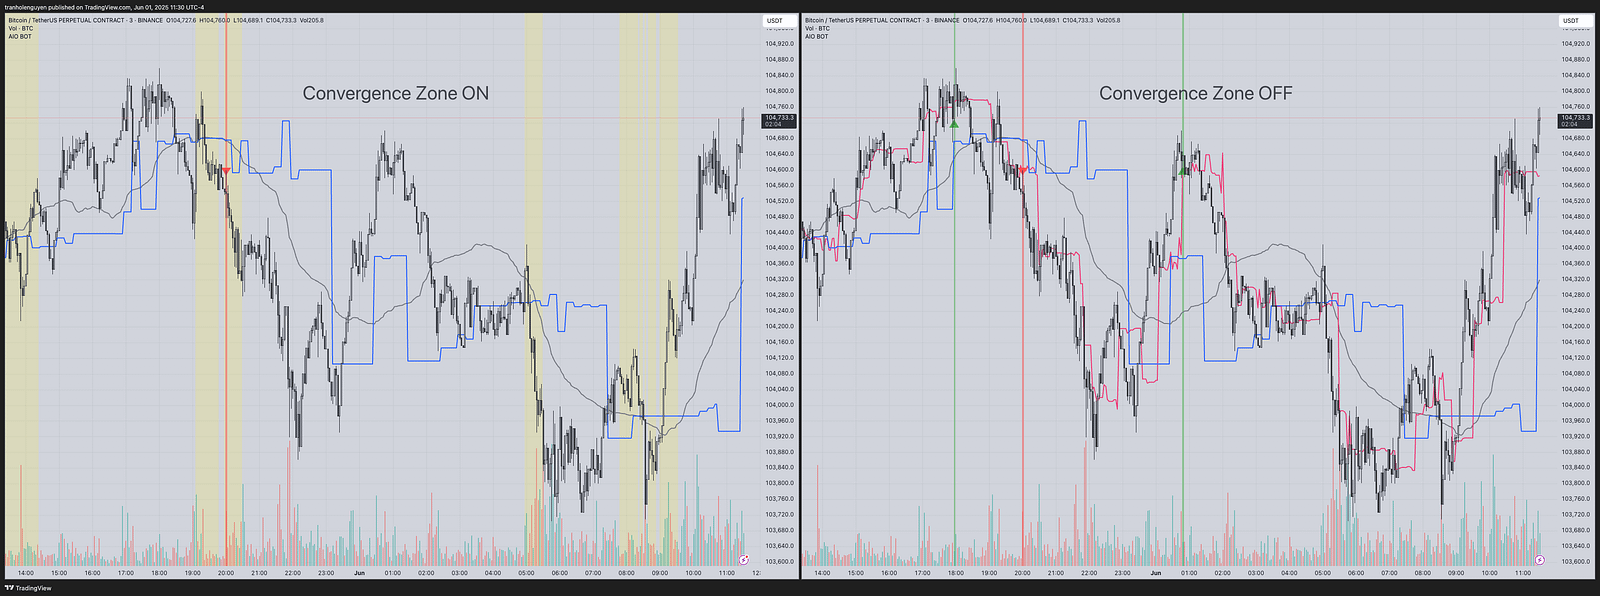
In general, since the core logic of both algorithms is how the candle reacts to the key volume , you can choose the Cross mode as Cross or Touch from the settings. And to filter good signals, we add pivot logics & the convergence zone (%ATR) with yellow background to filter only good buy/sell signals of the algorithms. You can also change the value to widen or narrow the convergence zone. The default value is 150. Convergence zones are often important zones because they show consensus between indicators. Price can react strongly here (support/resistance or breakout).
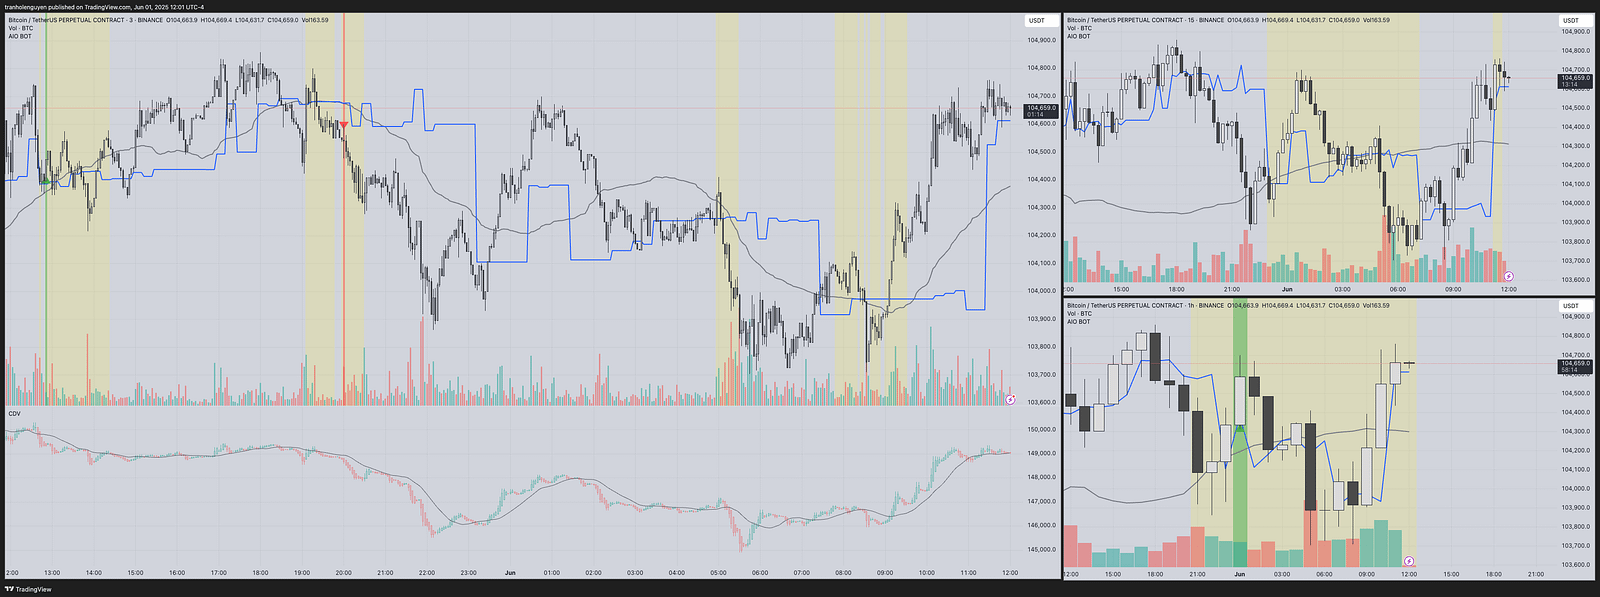
Chart Layout
We typically use a 3-layout chart for 3 Timeframes:
3m
15m
1h
For other indicators, we also use them together for confluence analysis:
CDV, which is the Cumulative Delta Volume of LonesomeTheBlue.
How to Use AIO BOT
Explaining this in words might cause some confusion. To make it clearer, please visit the YouTube link to watch the user guide video (to be added later).
AIO BOT is not a fully automated 100% BOT. It generates signals to indicate that the price might be in a buy/sell zone. The actual entry candle/price might be the candle that triggered the signal or a different one.
Since AIO BOT uses higher timeframe data, it may sometimes produce repaint signals, especially when the signal is triggered by the key volume line of the higher timeframe (the blue line). To ensure the signal is accurate, wait for at least 2–3 more candles, then refresh the chart to confirm it’s not a false signal before entering the trade.
To summarize: False signal = an alert occurred or a signal appears on the chart but then when you refresh the chart. It disappear. However, it may still be a potential zone to trade manually using logic like below:The entry candle should be red for a sell trade and green for a buy trade.
The entry candle should be in a pullback zone from a larger trend.
The entry candle should cross one of the three lines: the key volume line of the main timeframe, the key volume line of the higher timeframe, or the VWAP line.
Consider not entering the trade immediately if the signal candle is too far from the VWAP line. Wait for the price to retrace to the VWAP zone and also retrace to key volume lines where those lines go like horizontal lines. Although we added Convergence Threshold to filter these ones but there may be some cases that we have not covered yet.
Prioritize selling when the price is below all three lines: the two key volume lines and the VWAP line.
Prioritize buying when the price is above all three lines: the two key volume lines and the VWAP line.
You can manually analyze and choose the buy/sell point based on the rules we just mentioned, without necessarily waiting for a signal candle from the BOT.
For CDV analysis: Set the SMA value to 20. If you want to increase the win rate, make sure the CDV candle is green and above the SMA when buying, and red and below the SMA when selling. CDV can also be used for analysis when the CDV candle retraces back to the SMA line as a potential entry point.
If the AIO BOT in a higher timeframe like 15m or 1h is showing a buy signal, but the lower timeframe (3m) is showing a reverse sell signal, consider not entering the trade and prioritize the higher timeframe.
Regarding the key volume lines: These lines indicate where price reacts the most. Therefore, when buying/selling near the key volume lines, especially when the lines go horizontally and the price is retracing to it, this is a good entry point for a solid risk-to-reward ratio, minimizing loss, and maximizing profit.
For setting TP and SL: You need to set them manually, typically at nearby highs/lows. We will explain this in the video to make it clearer, as it varies depending on the chart’s context.
In terms of experience with entering trades, we mostly use limit orders, with positions always around the key volume lines. You will need to analyze and choose the lines based on your own judgment.
When there are three consecutive signals in the same direction, we believe that by the third signal, you should consider not trading because the trend might be too strong and there could be a reversal risk at that point.
Timeframes and Higher Timeframes Settings
For 1m, 3m, and 5m TFs: We usually set the higher TF to 15m.
For 15m TF: We usually set the higher TF to 1h.
For 1h TF: We usually set the higher TF to 4h.
However, these values may differ for each symbol, so you should adjust them to fit your own trading style.
AIO BOT can be combined with other AIO indicators to increase the win rate. Depending on your trading method, you can choose the appropriate setup.
Summary
With AIO BOT, whether there is a signal or not on the chart. You can use above logic we explained to find a good entry. After months of backtesting, we are confident about the performance & the simplicity of our system.
Use or not. It is your choice. We do not run ads or do any campaign that fake gurus/fake experts do on social media to teach you/sell you their paper systems. We have written & described the simplest possible system above.
In the future, we are going to review performance of AIO BOT weekly & publish those videos on Youtube. You can verify them yourselves.
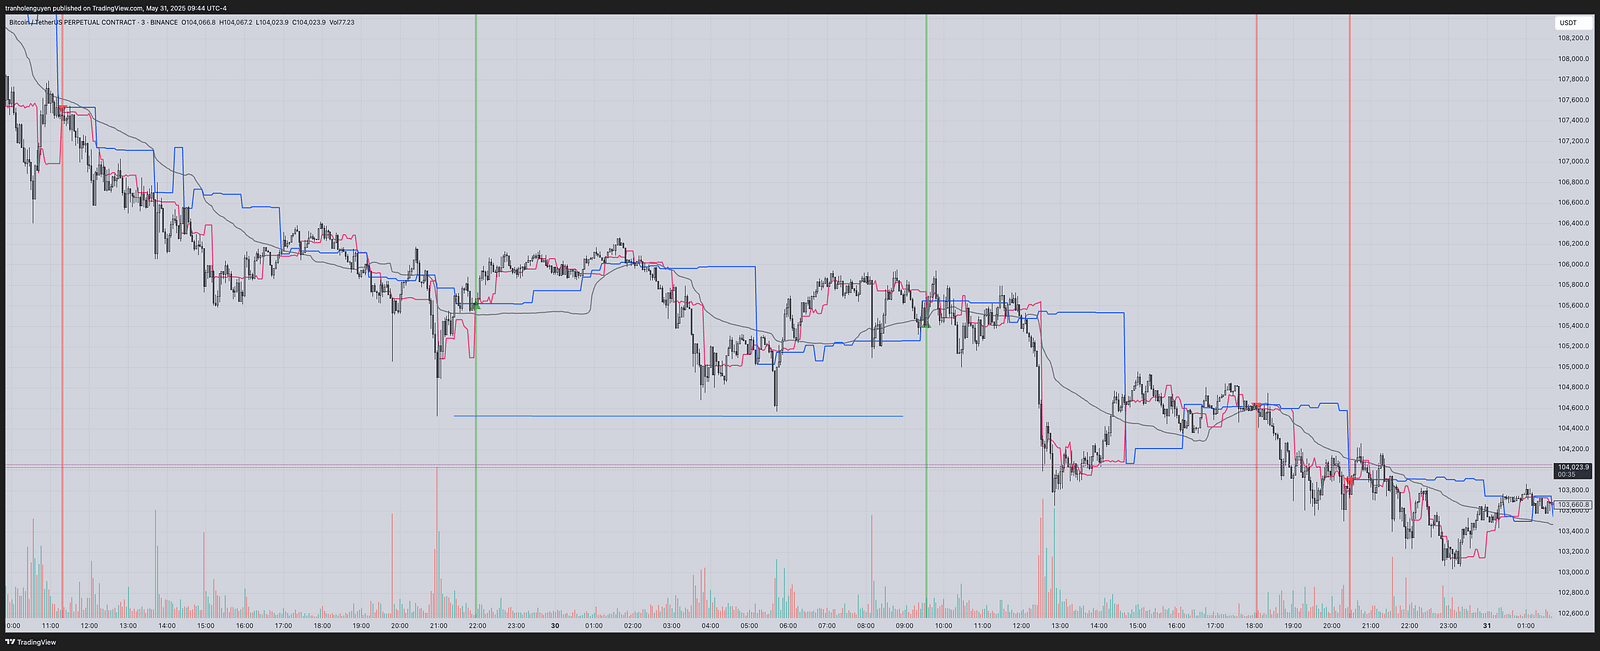
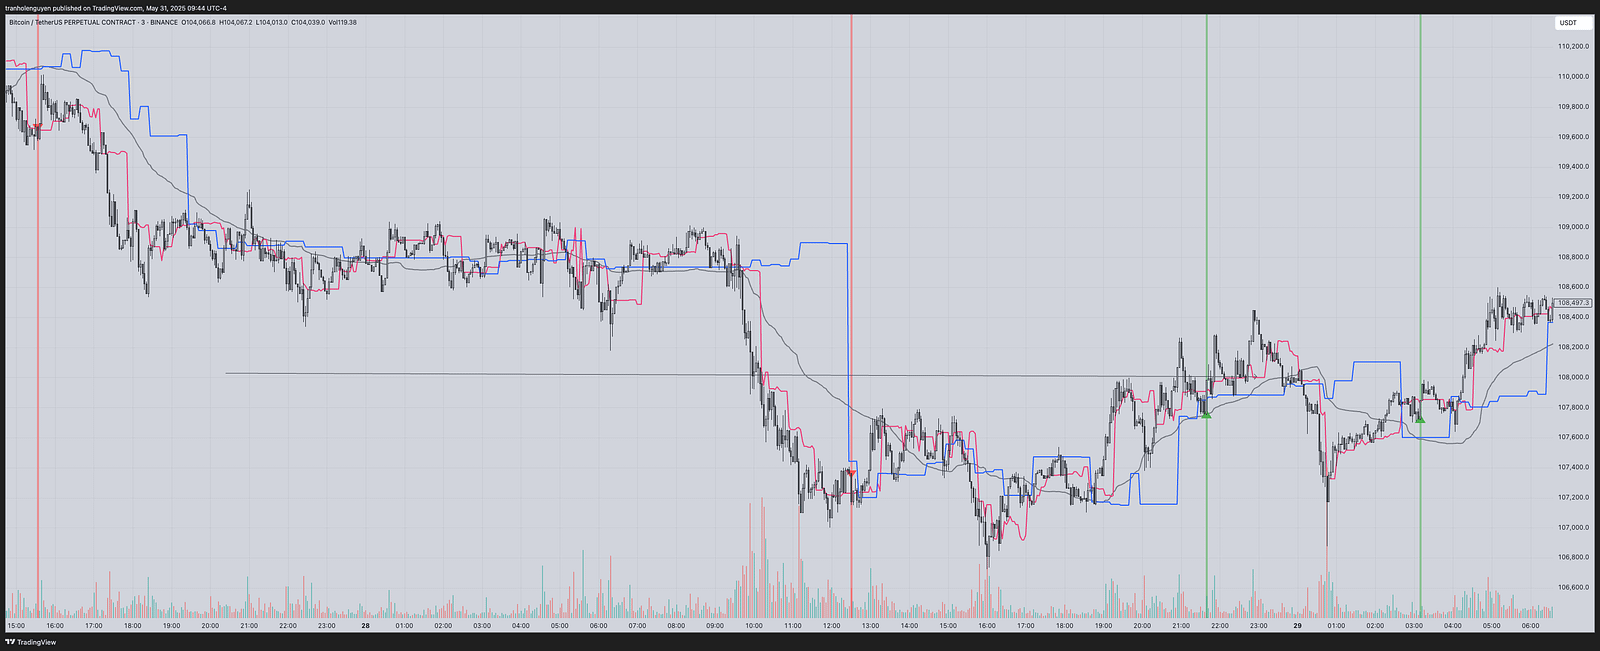
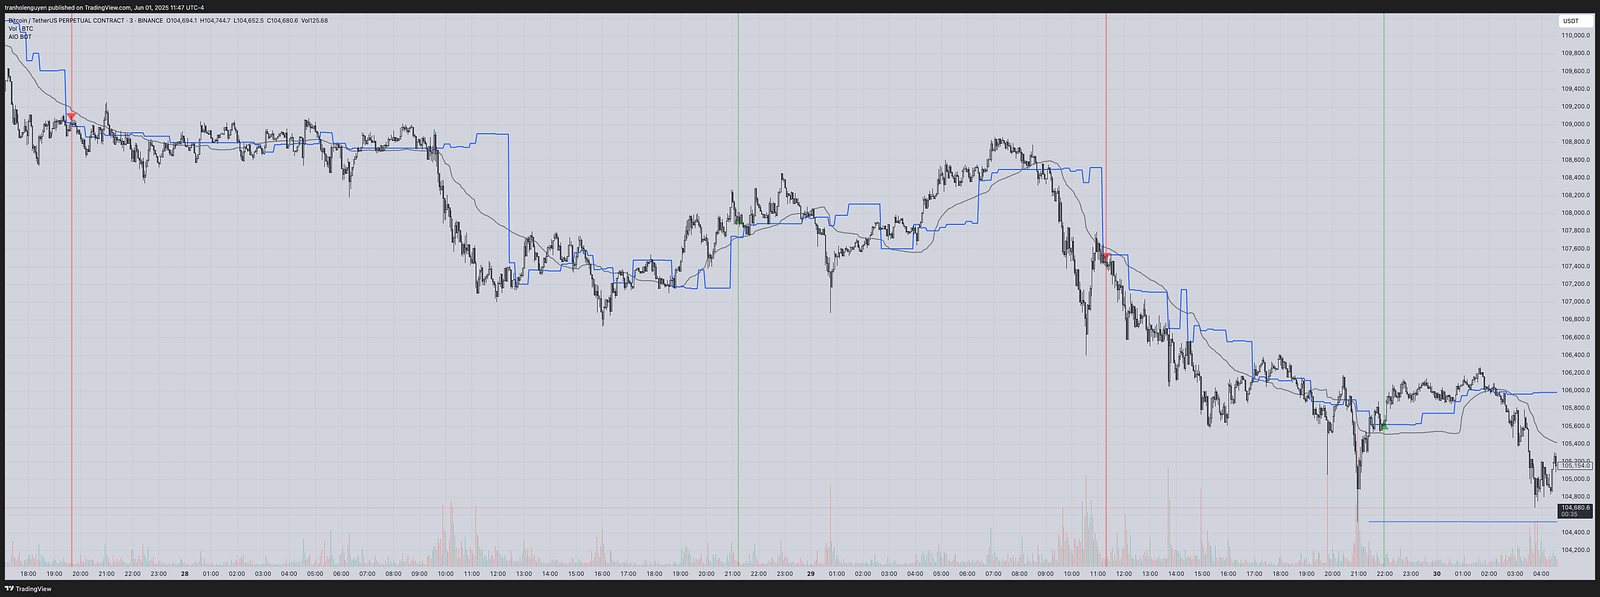
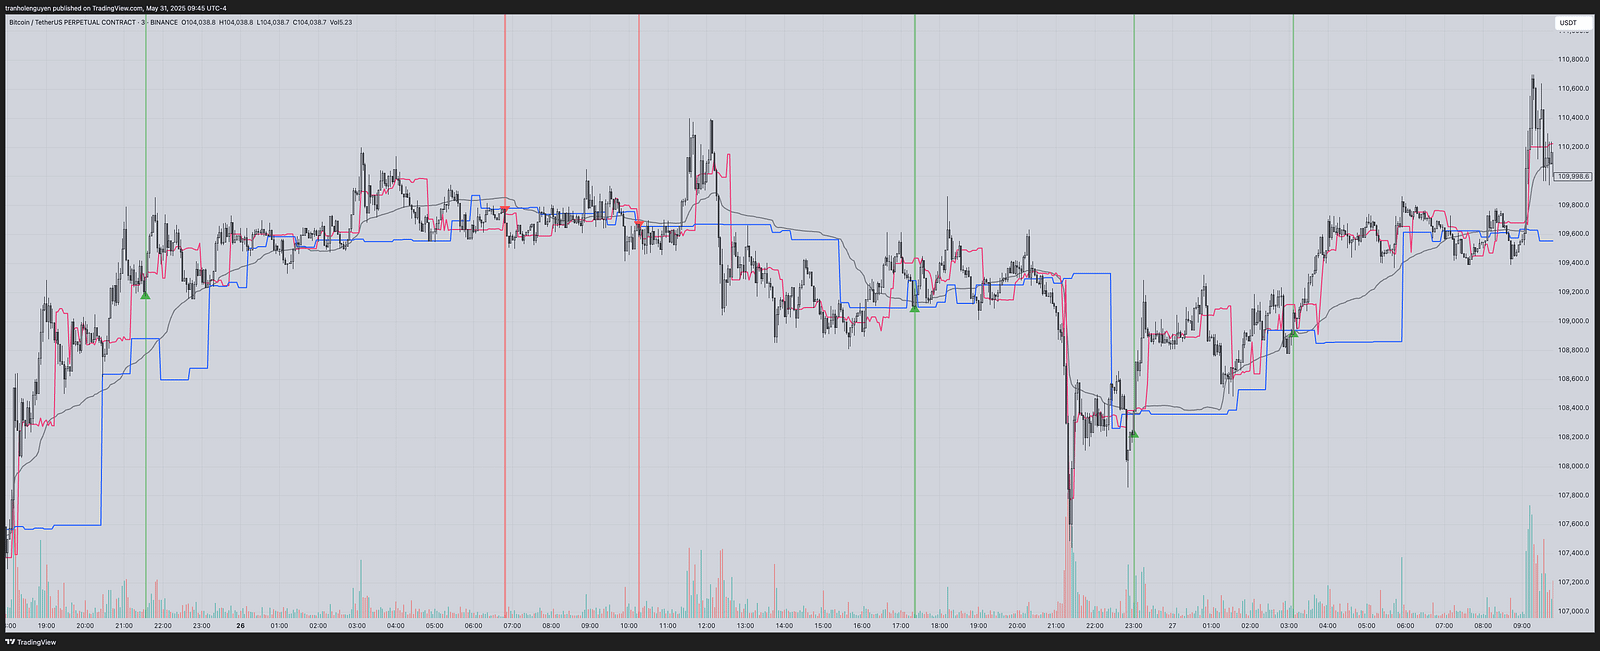
Some Explanatory Images
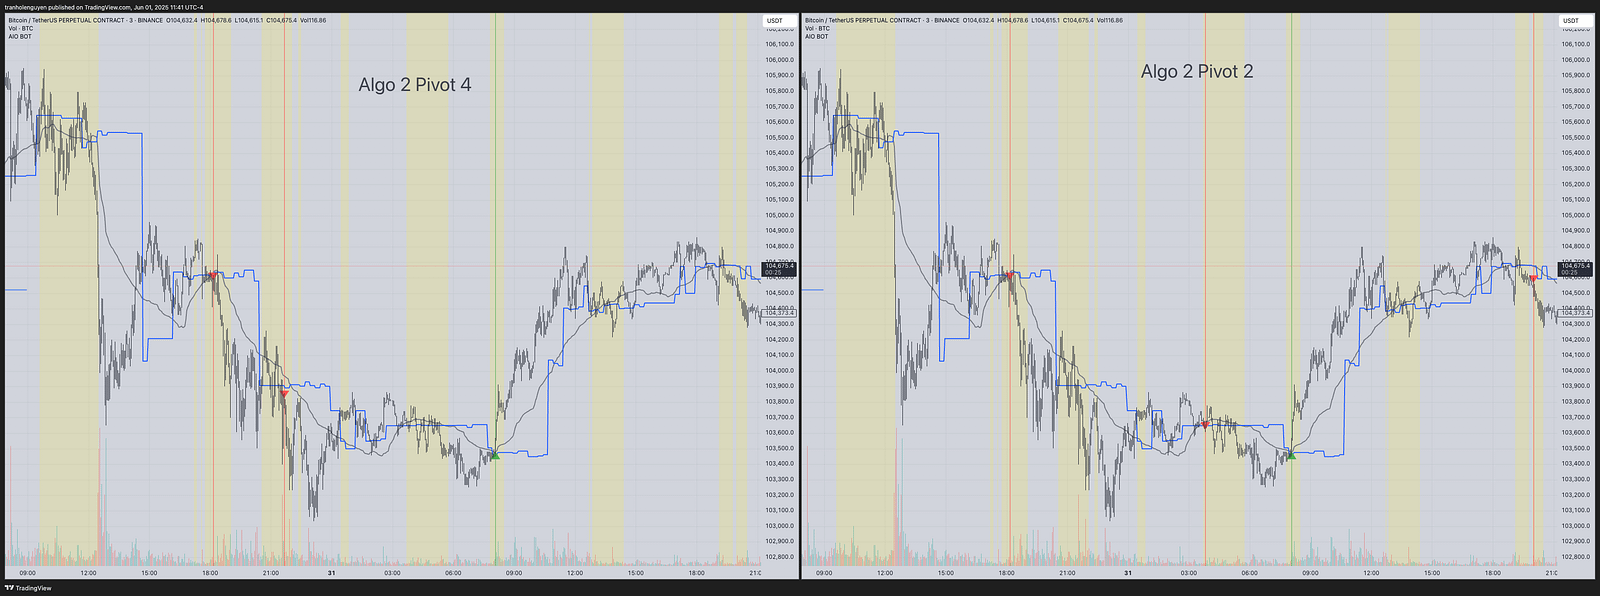
Some Trade Signal Images