
AIO Indicator — How to use Magic Bars
AIO Indicator — How to use Magic Bars
I would like to explain in detail about function Magic Bars of my All In One Price Action Indicator (TradingView) & give an example of how I use it to trade.

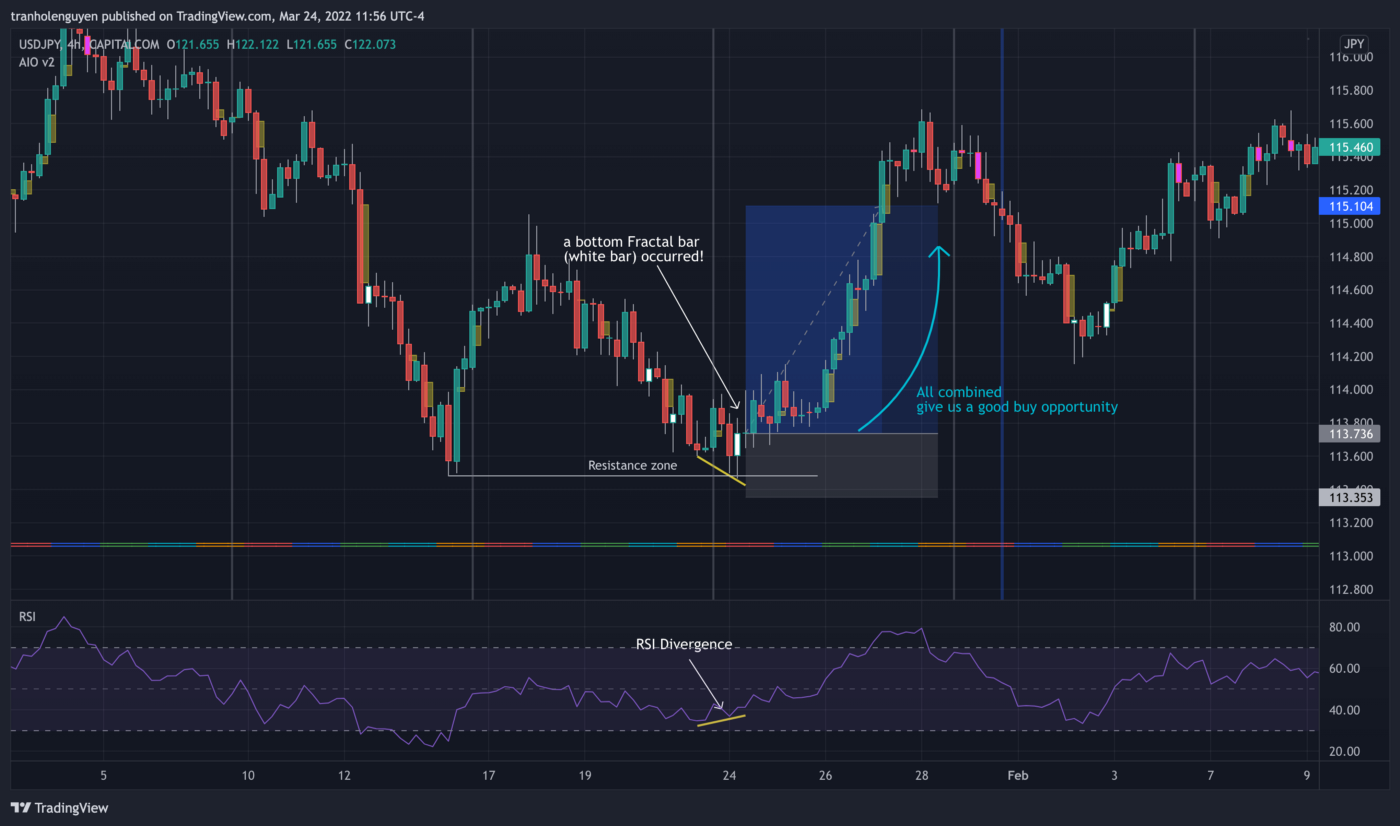
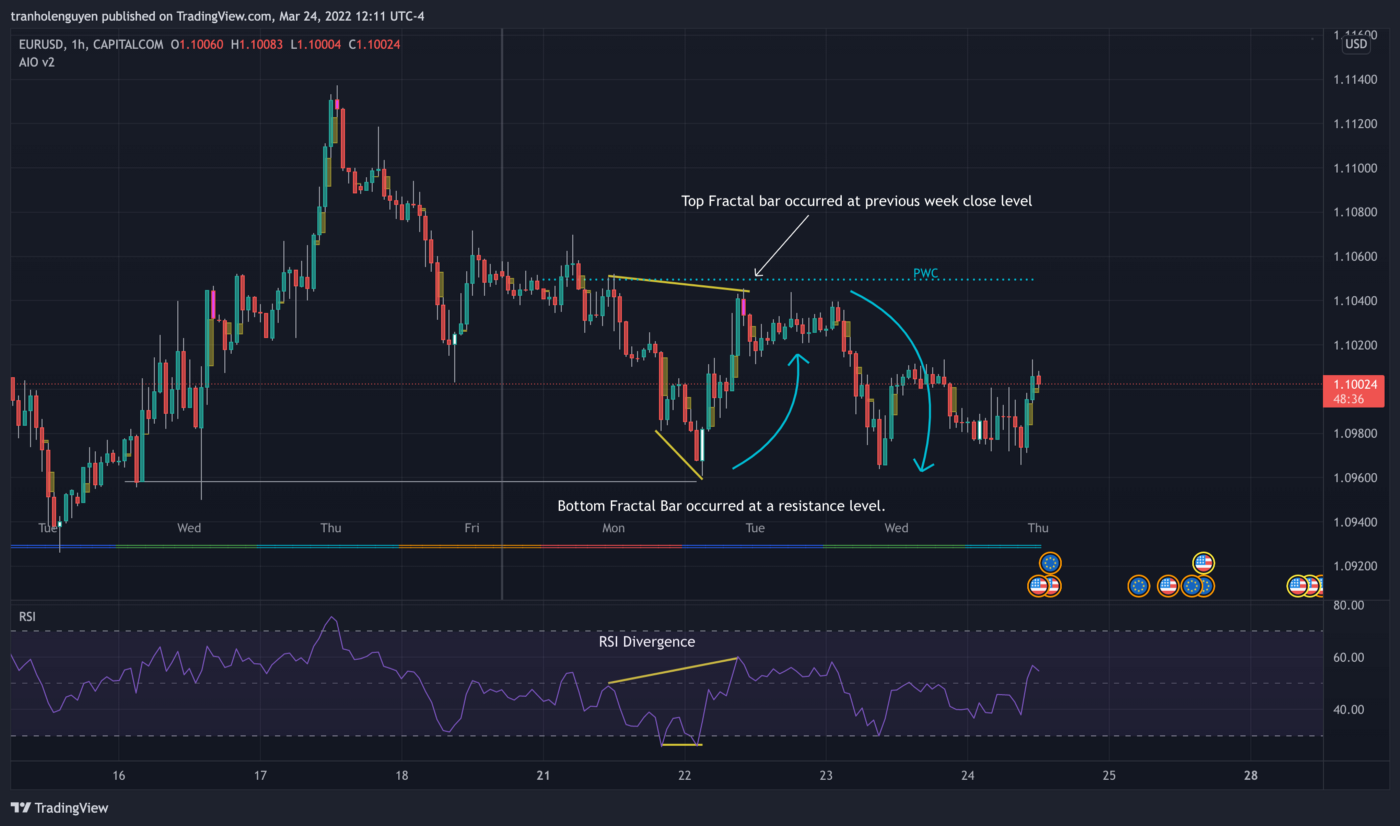
FRACTAL BAR
This bar occurs when the divergence occurs between the price & RSI. You can change the RSI period (default value is 14) & RSI source (open/high/low/close,…)
First, I would like to explain the word fractal: it is a pattern that repeats inside itself. A fractal divergence is a simple divergence that happens within another simple divergence, so in a symbol word: Fractal Strategy = Fractal bar + Fractal divergence (momentum divergence using RSI).
This bar or a fractal pattern/divergence itself should not be used as a signal for buy or sell, it is merely a precision tool that needs to be used at the right time. I often use this strategy in combination with other analysis factors like support & resistance, price action reading/interpretation, trend recognition,…
Analysis examples:
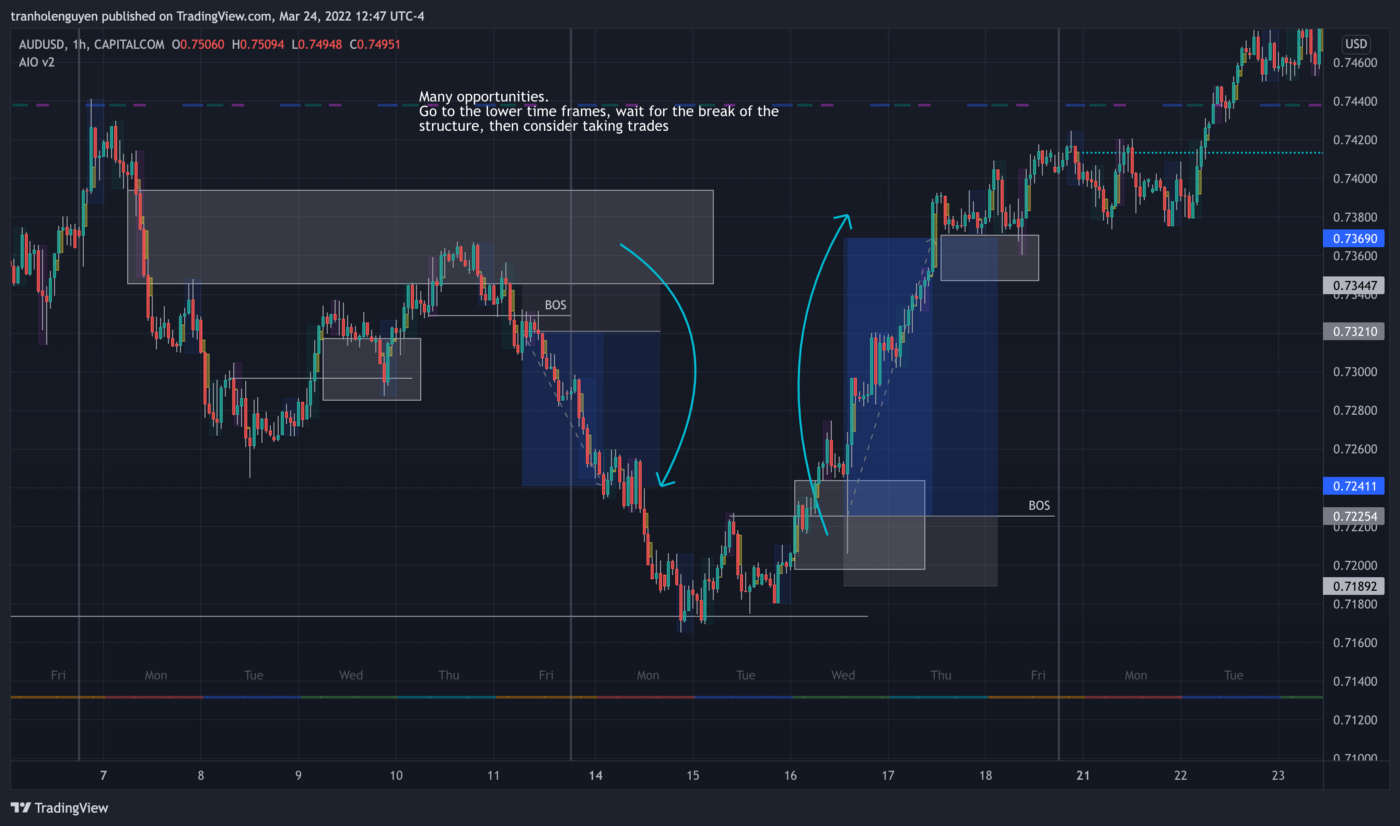
IMBALANCE BAR
After a sharp run in price, the large candles that form are the least efficiently trades in the range, this is a liquidity void. So this run creates imbalance bars/ranges (the bars with yellow color on the right side)
Price typically will want to revisit this range, trade back inside its current range, and return to the levels it recently moved from.
Analysis examples:

Not available yet, but I’m thinking about adding one more type of magic bar but still working on its specification for now.
Please read the full article about my AIO — All In One Price Action Indicator below for more information & other functions of my indicator.
—
Nguyen Tran