AIO Indicator — How to use Price Levels
I would like to explain in detail about function Price Levels of my All In One Price Action Indicator (TradingView) & give an example of how I use it to trade.

PRICE LEVELS
The indicator has settings showing the following important price levels, you can choose which one you like to display on the chart:
Previous 1H High/Low/Close/Equilibrium
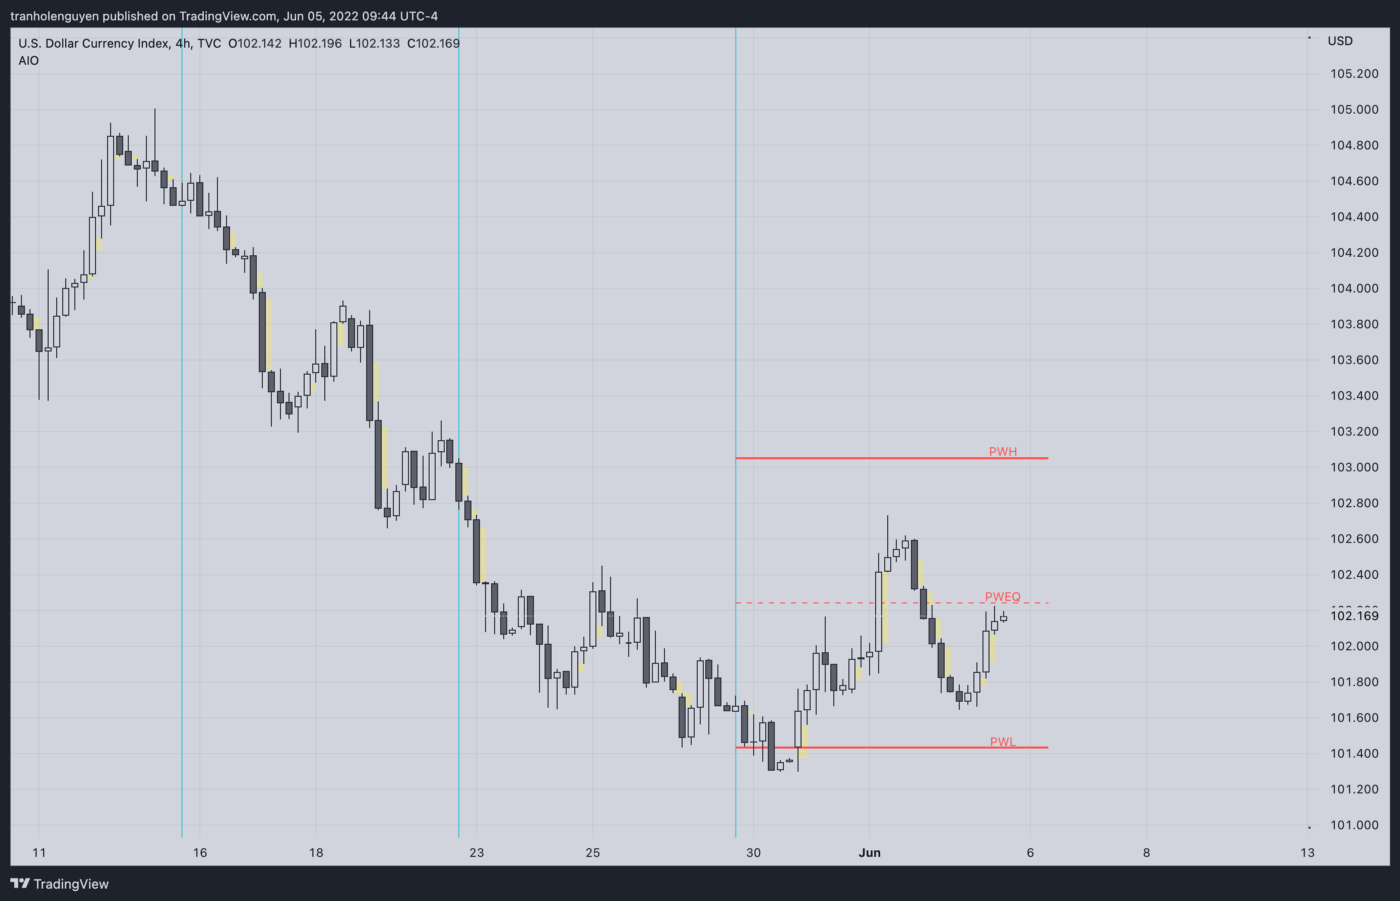
Previous 4H High/Low/Close/Equilibrium
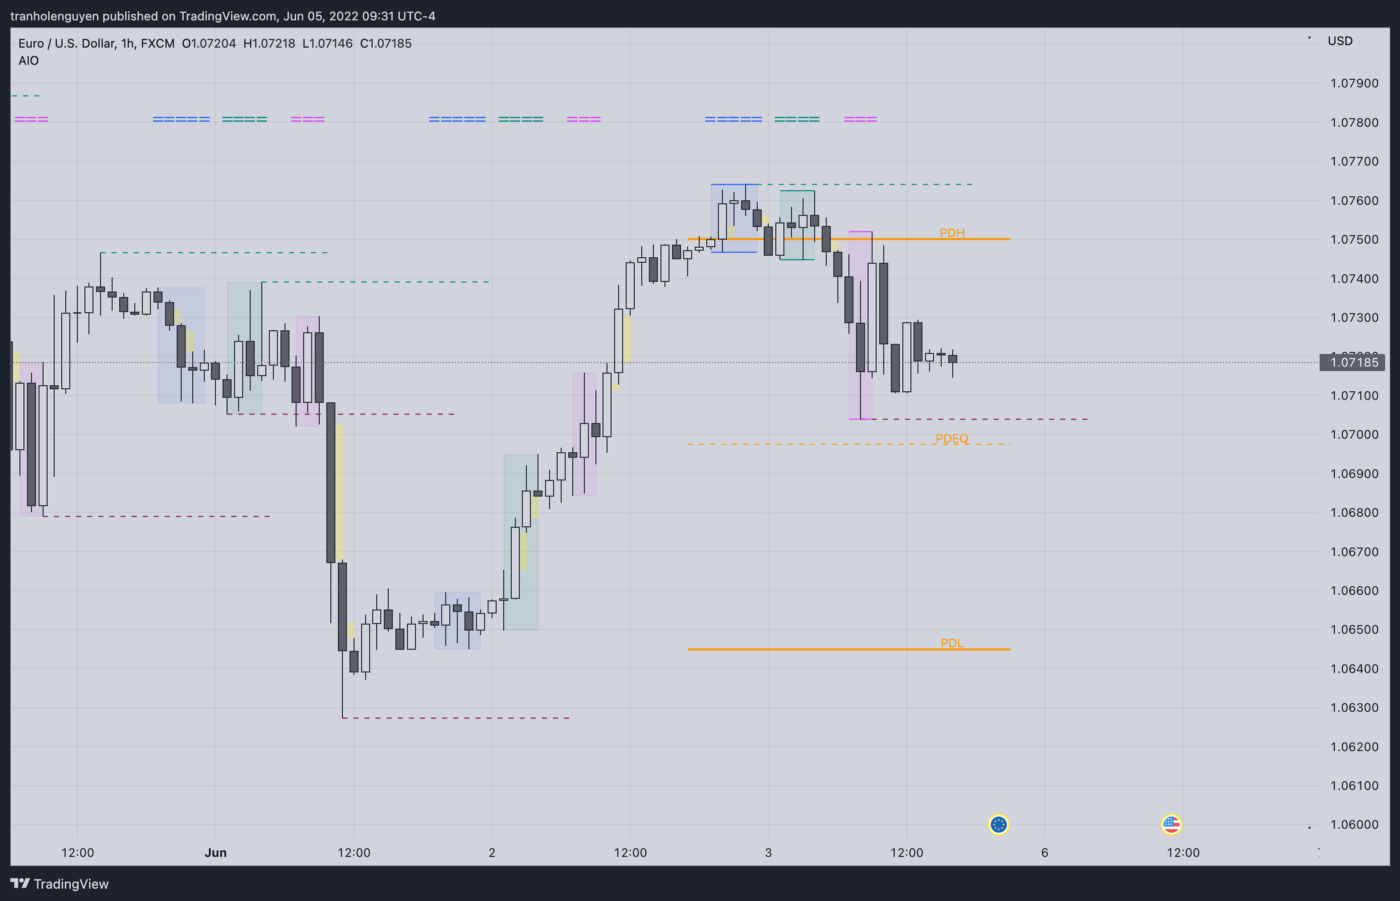
Previous Day High/Low/Close/Equilibrium
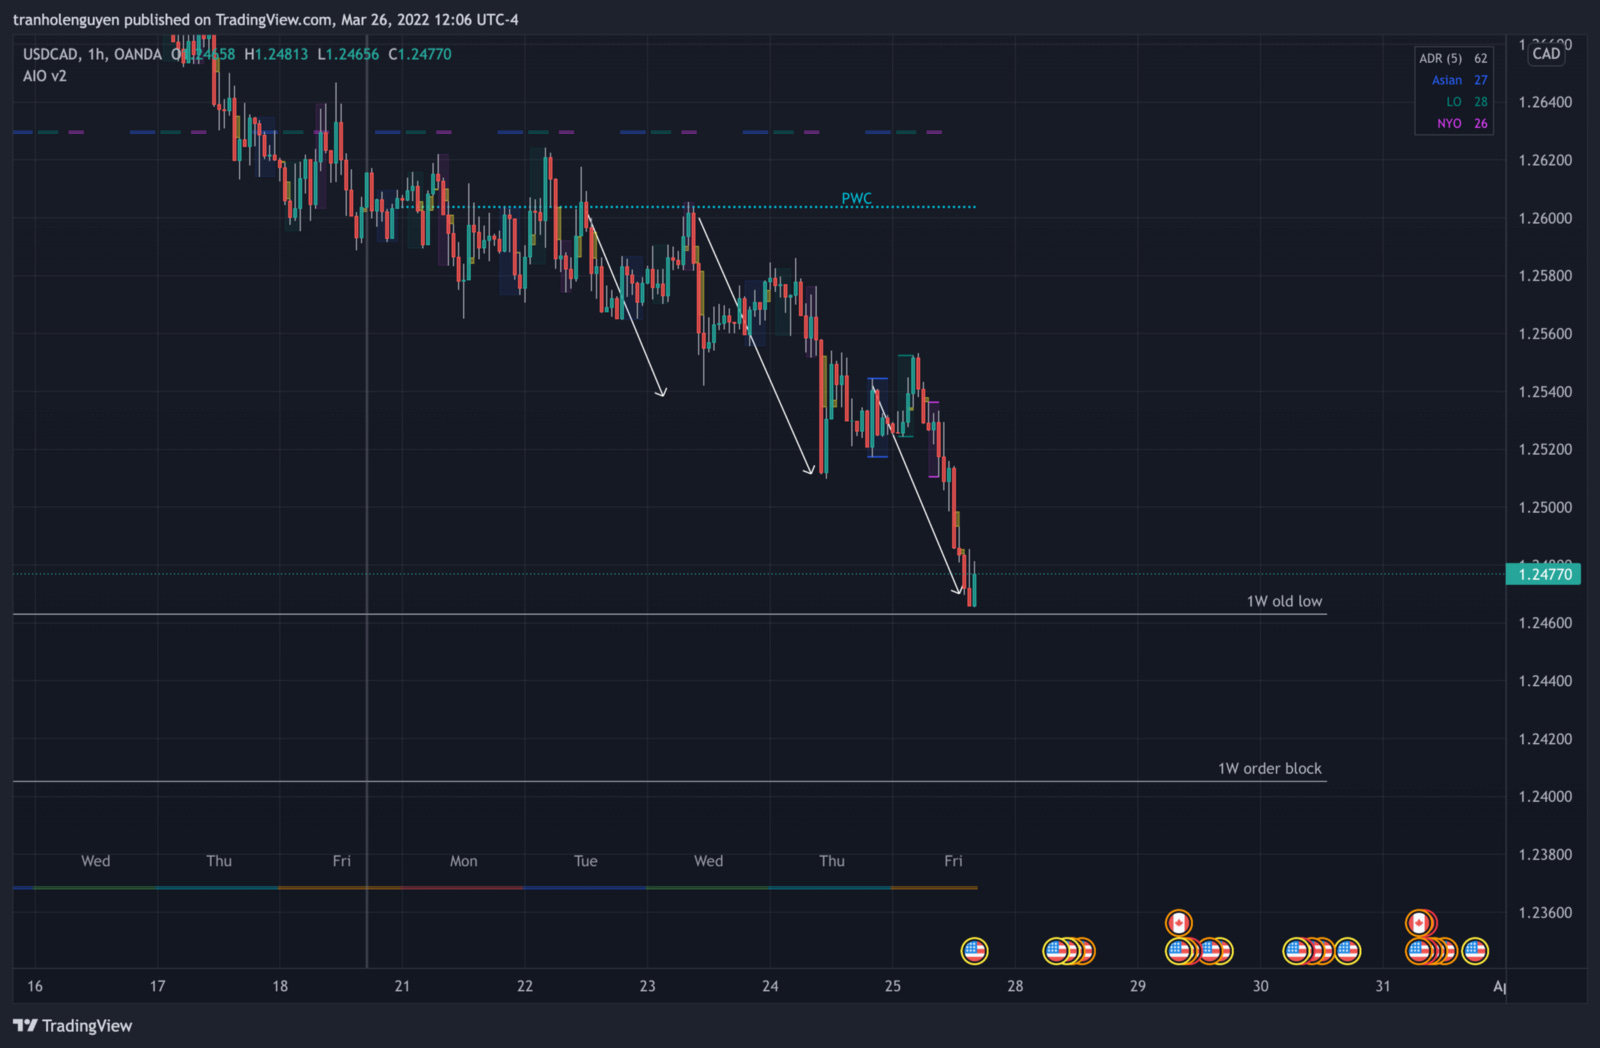
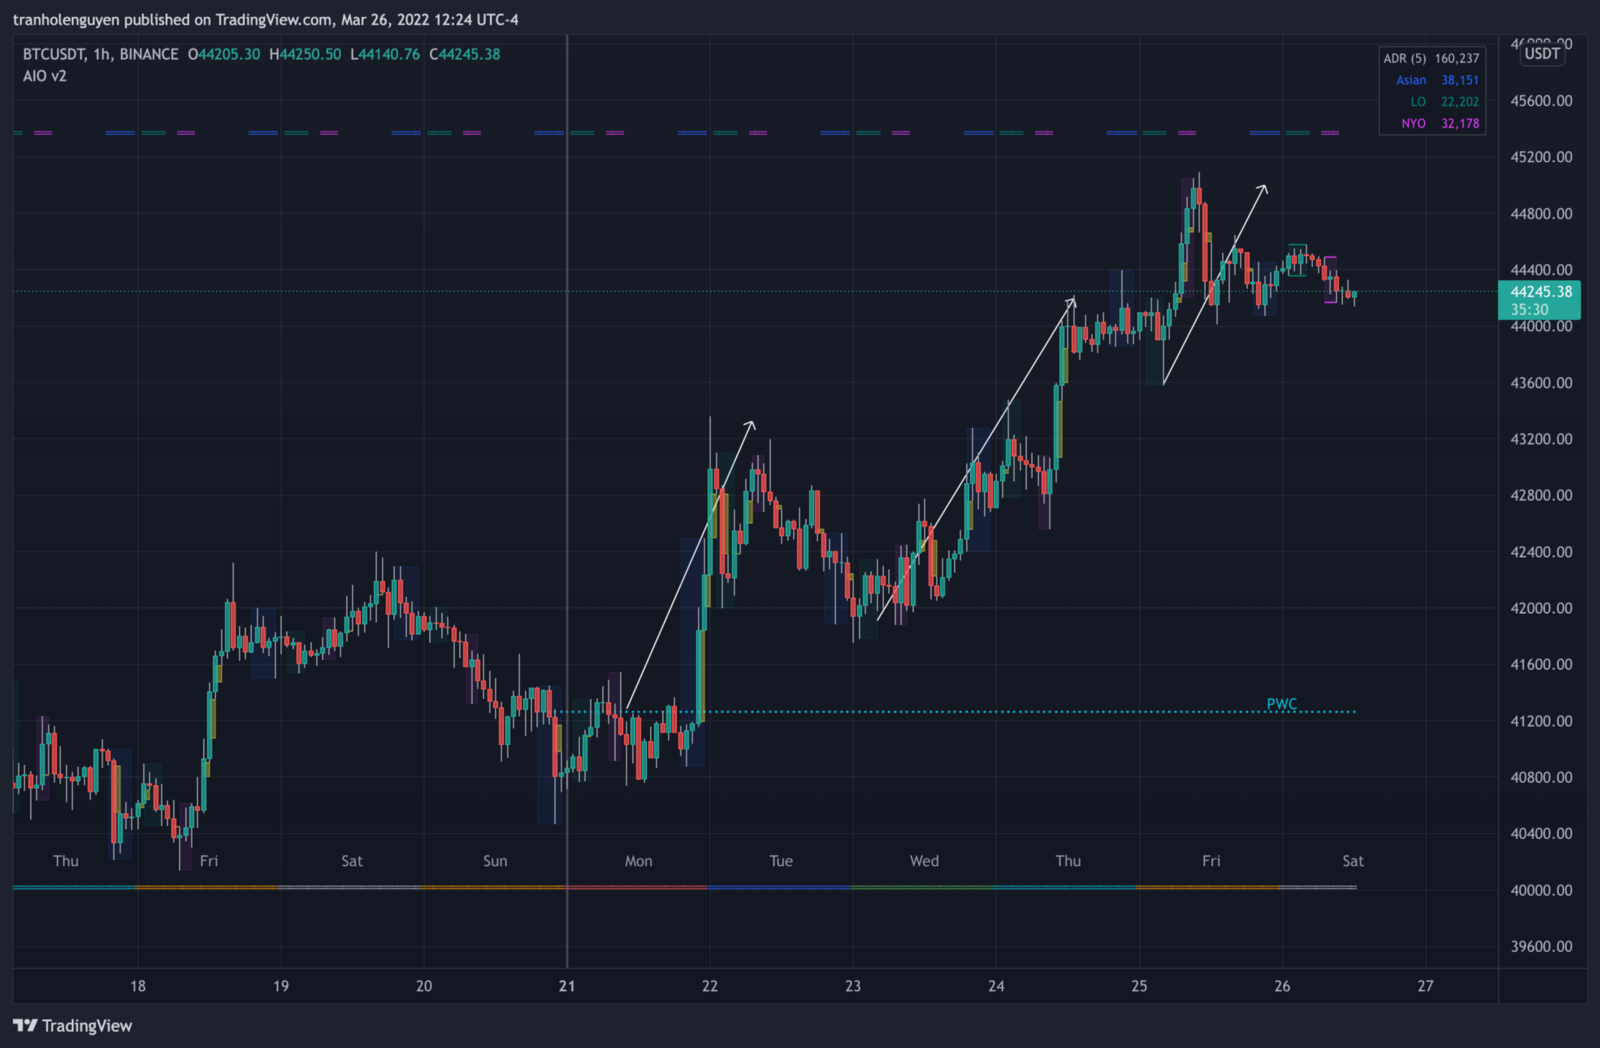
Previous Week High/Low/Close/Equilibrium
Previous Month High/Low/Close/Equilibrium
ADR High/Low (the default value is 5)
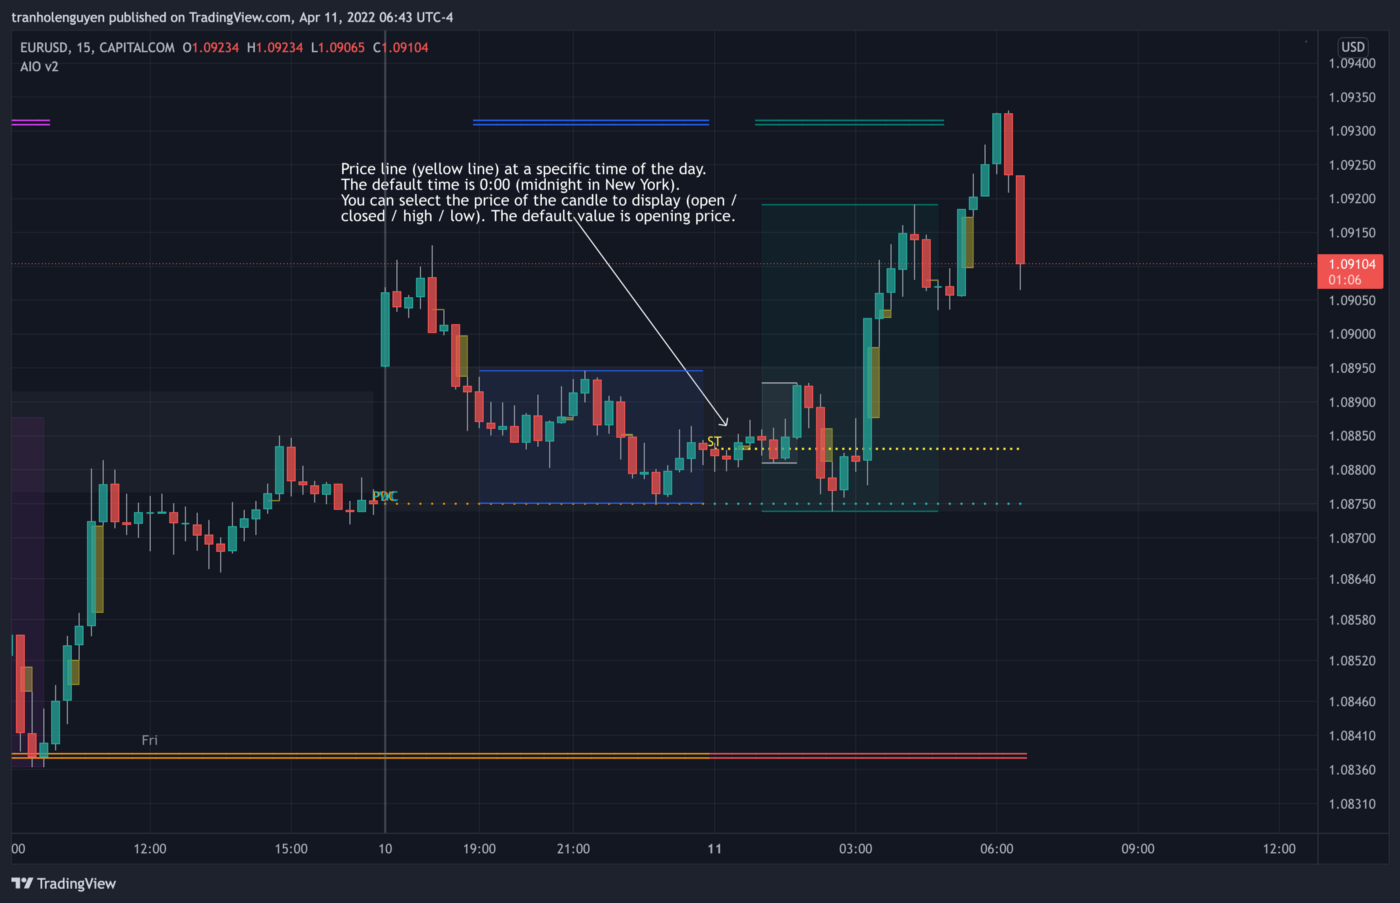
Price lines at a specific time (Open/Close/High/Low)
I like this indicator very much, especially when trading intraday on lower time frames. Personally, I use Previous Week Close the most.
About ADR levels (learned from ICT)
I use a 5 day ADR (average daily range) to help me determine possible intraday range extremes for a single day.
If I am Bullish — I look for the market to trade to the ADR High.
If I am Bearish — I look for the market to trade to the ADR Low.Keep in mind that the ADR does not have to fill for the day.
ADR can be expected to act as 1/2 of the actual ADR in some conditions like when a large impulse swing can surge the daily range twice the ADR when the ADR is under ~60 pips.
I always take or have ~60–80% off at 5 days ADR projections.
Can use 5 days ADR as stop loss level.
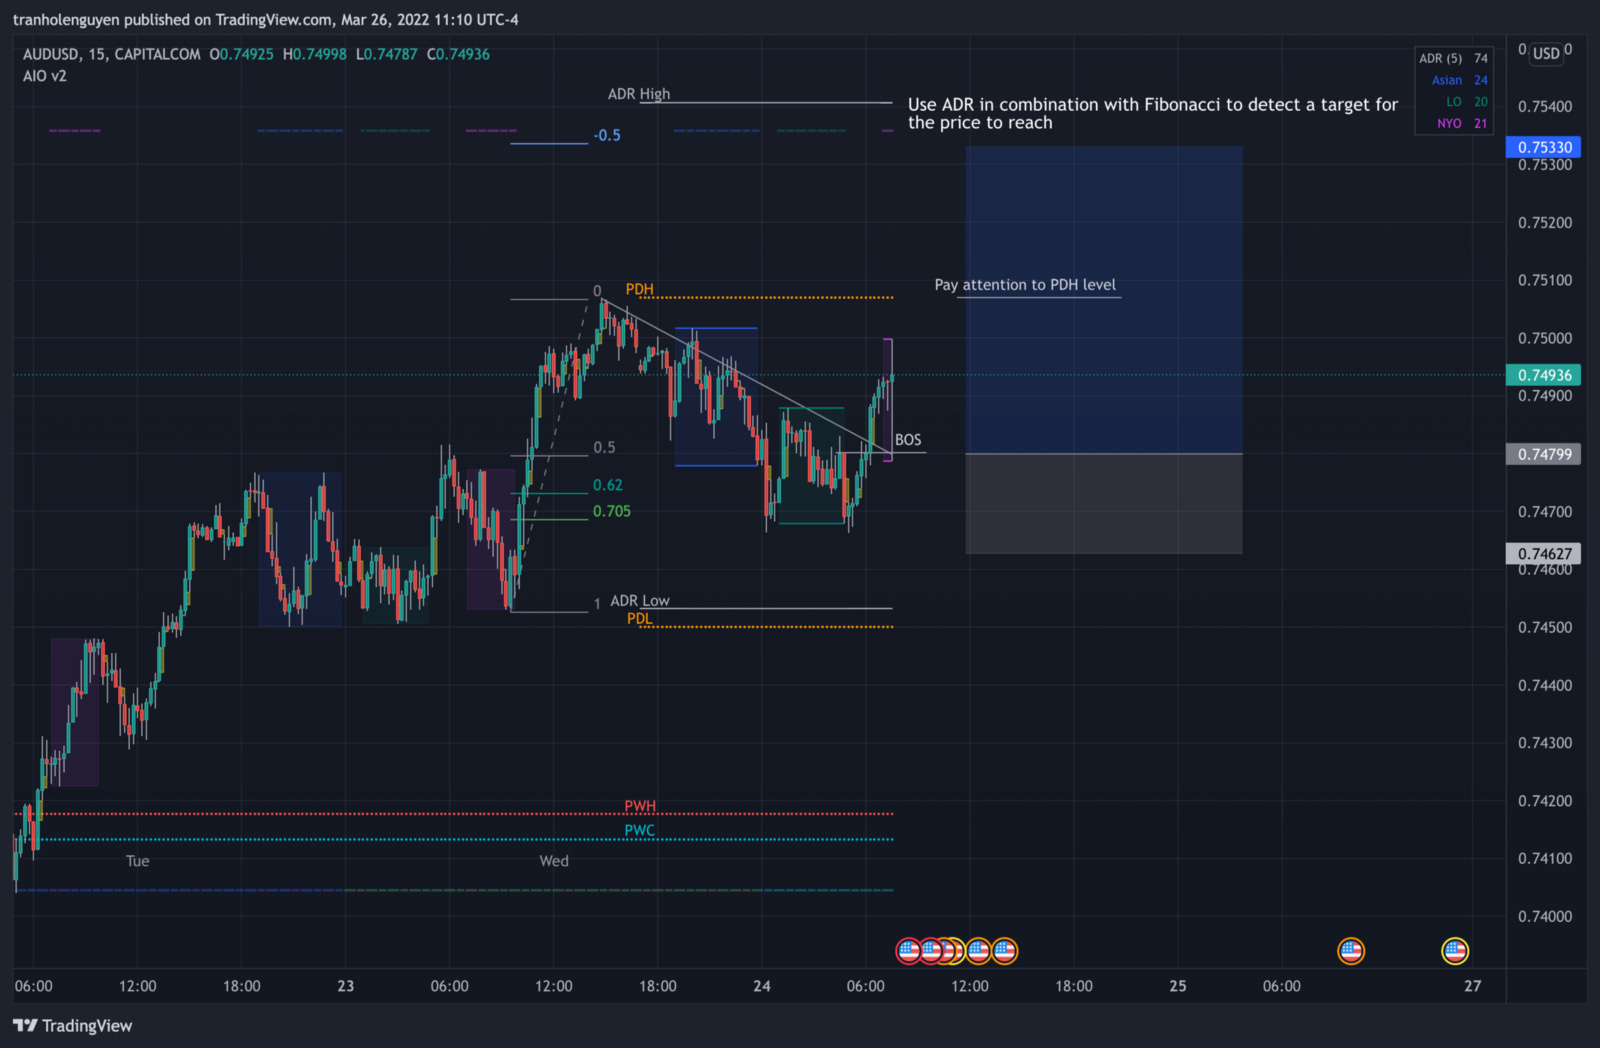
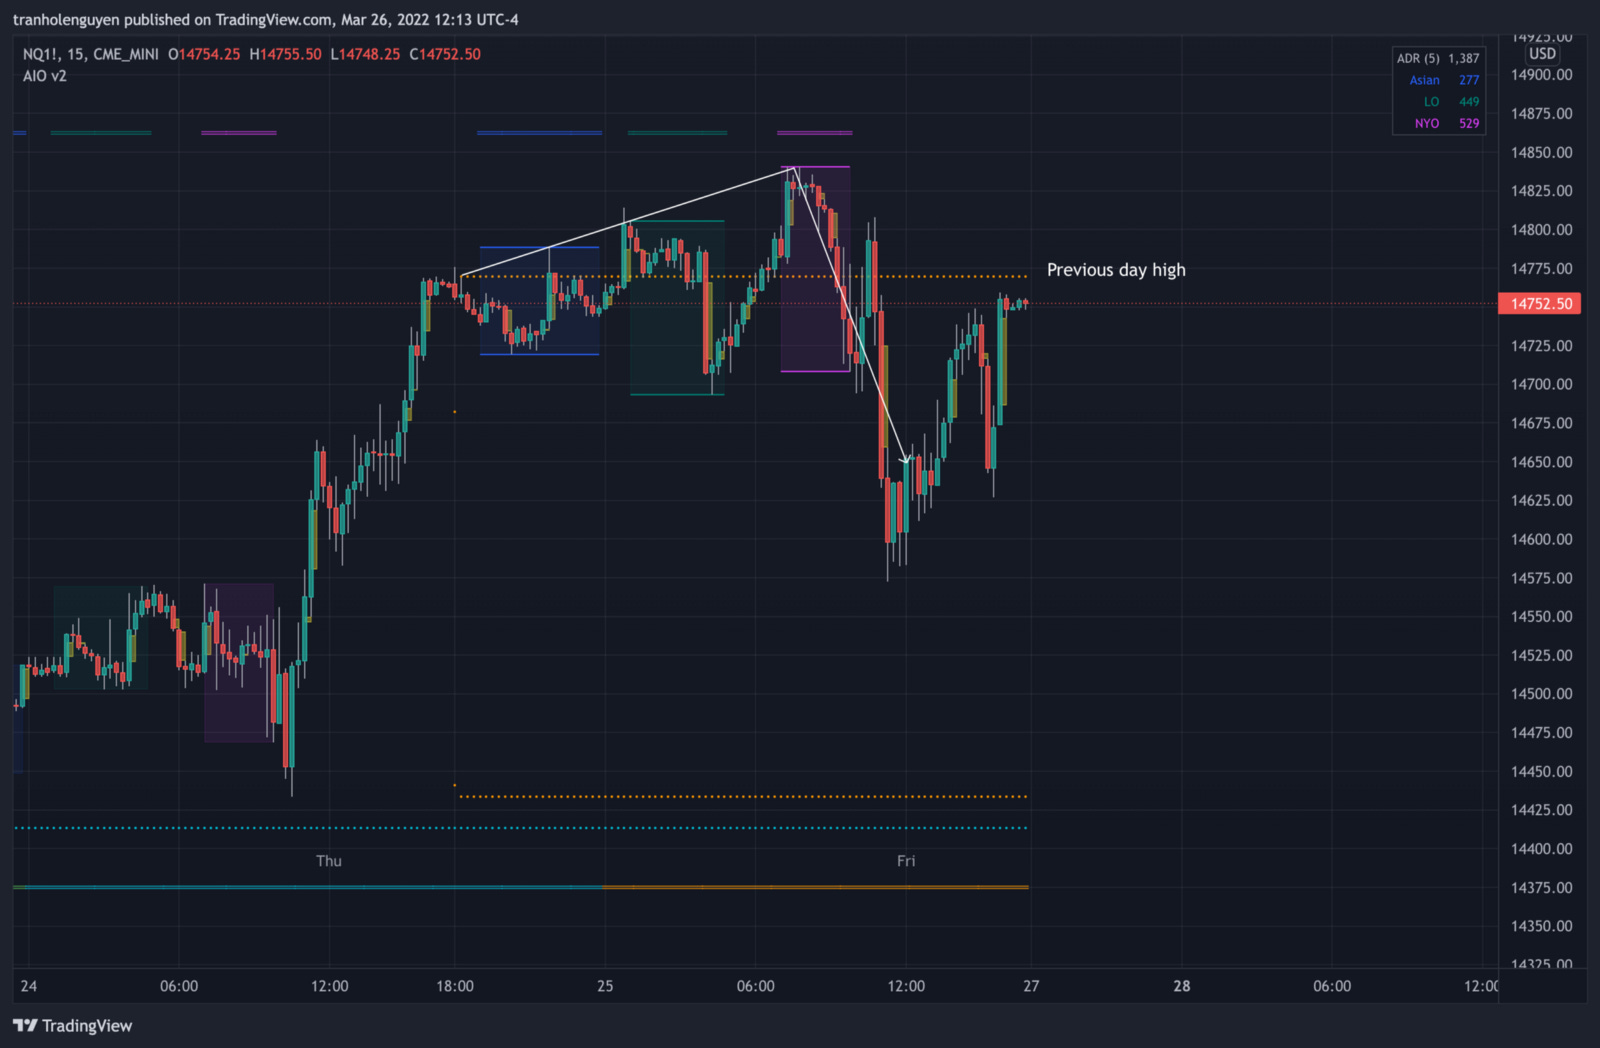
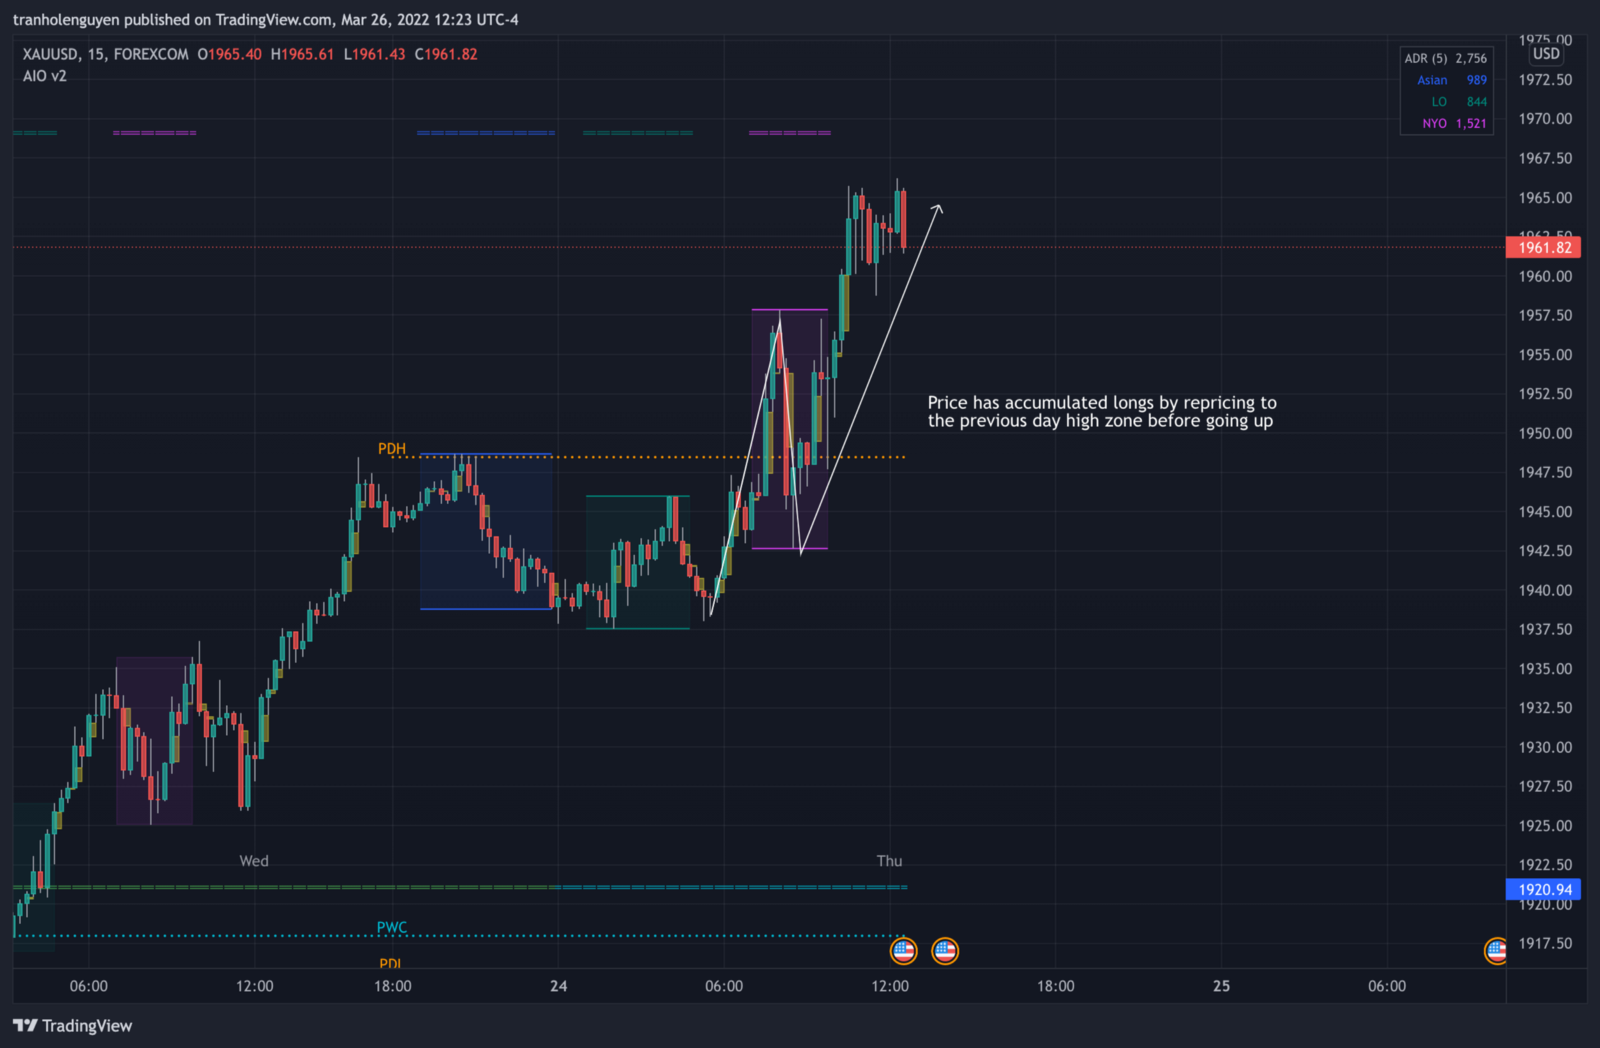
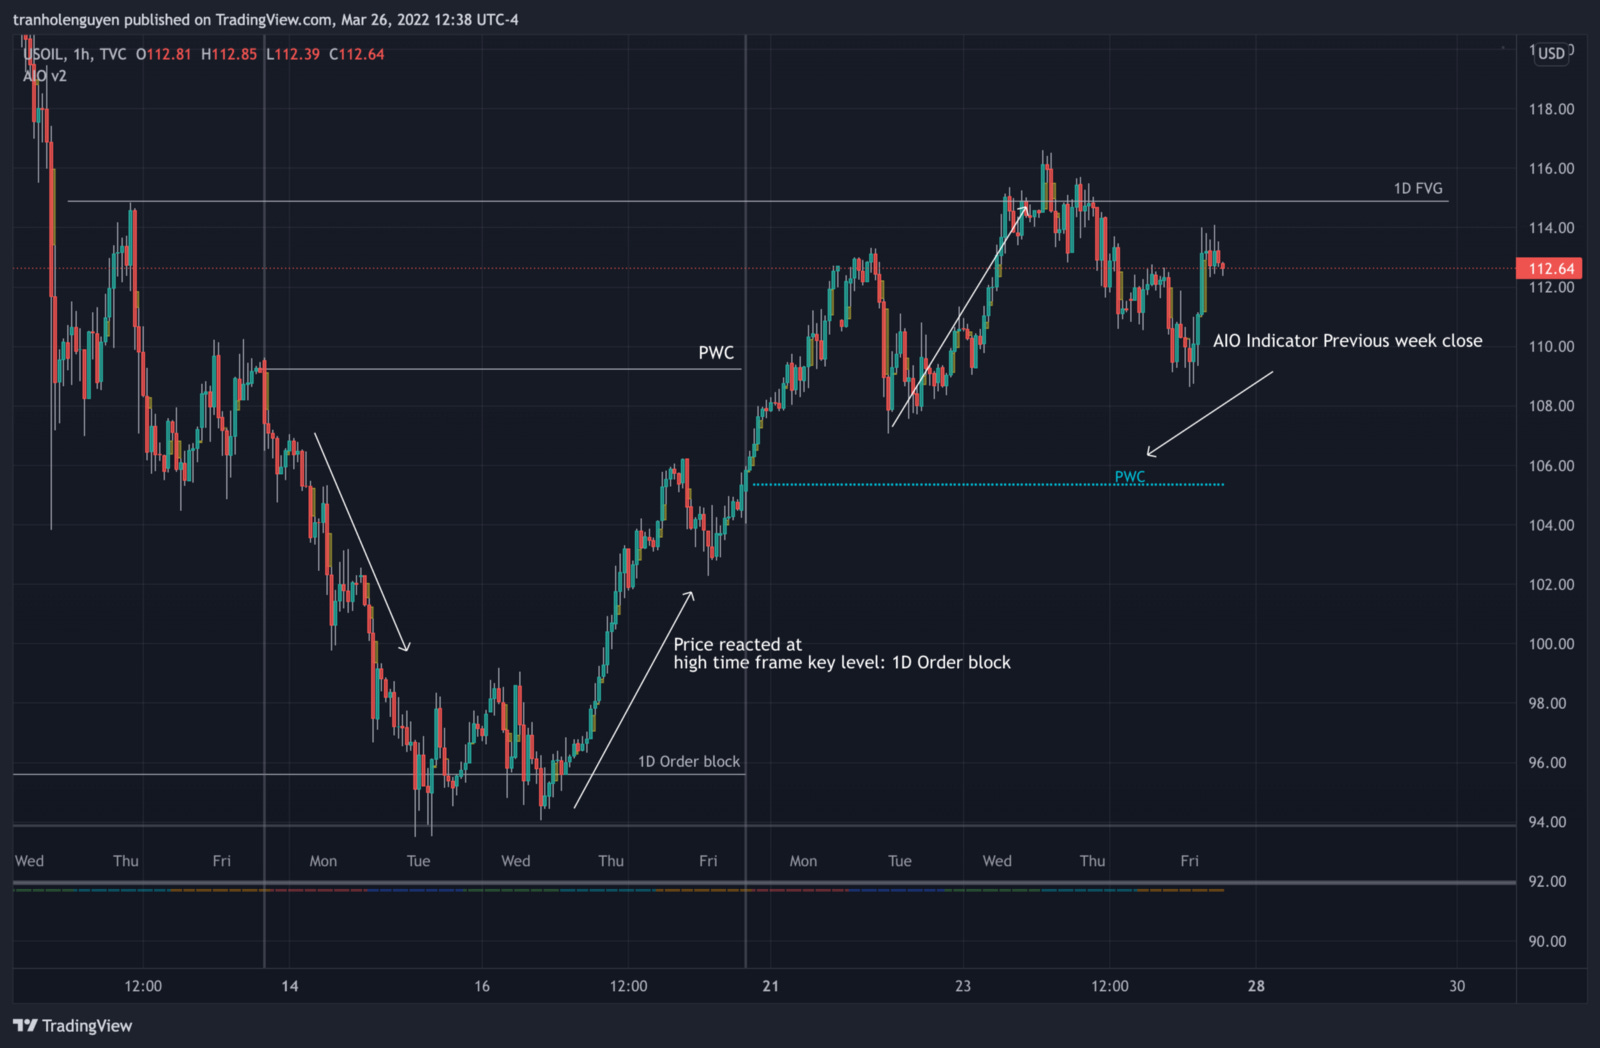
Previous Day’s High/Low or Previous Week’s High/Low are also key levels to pay attention to how price reacts at these levels. For example, These are maybe market retrace/reversal/accumulation areas that market makers aim to raid retail traders.
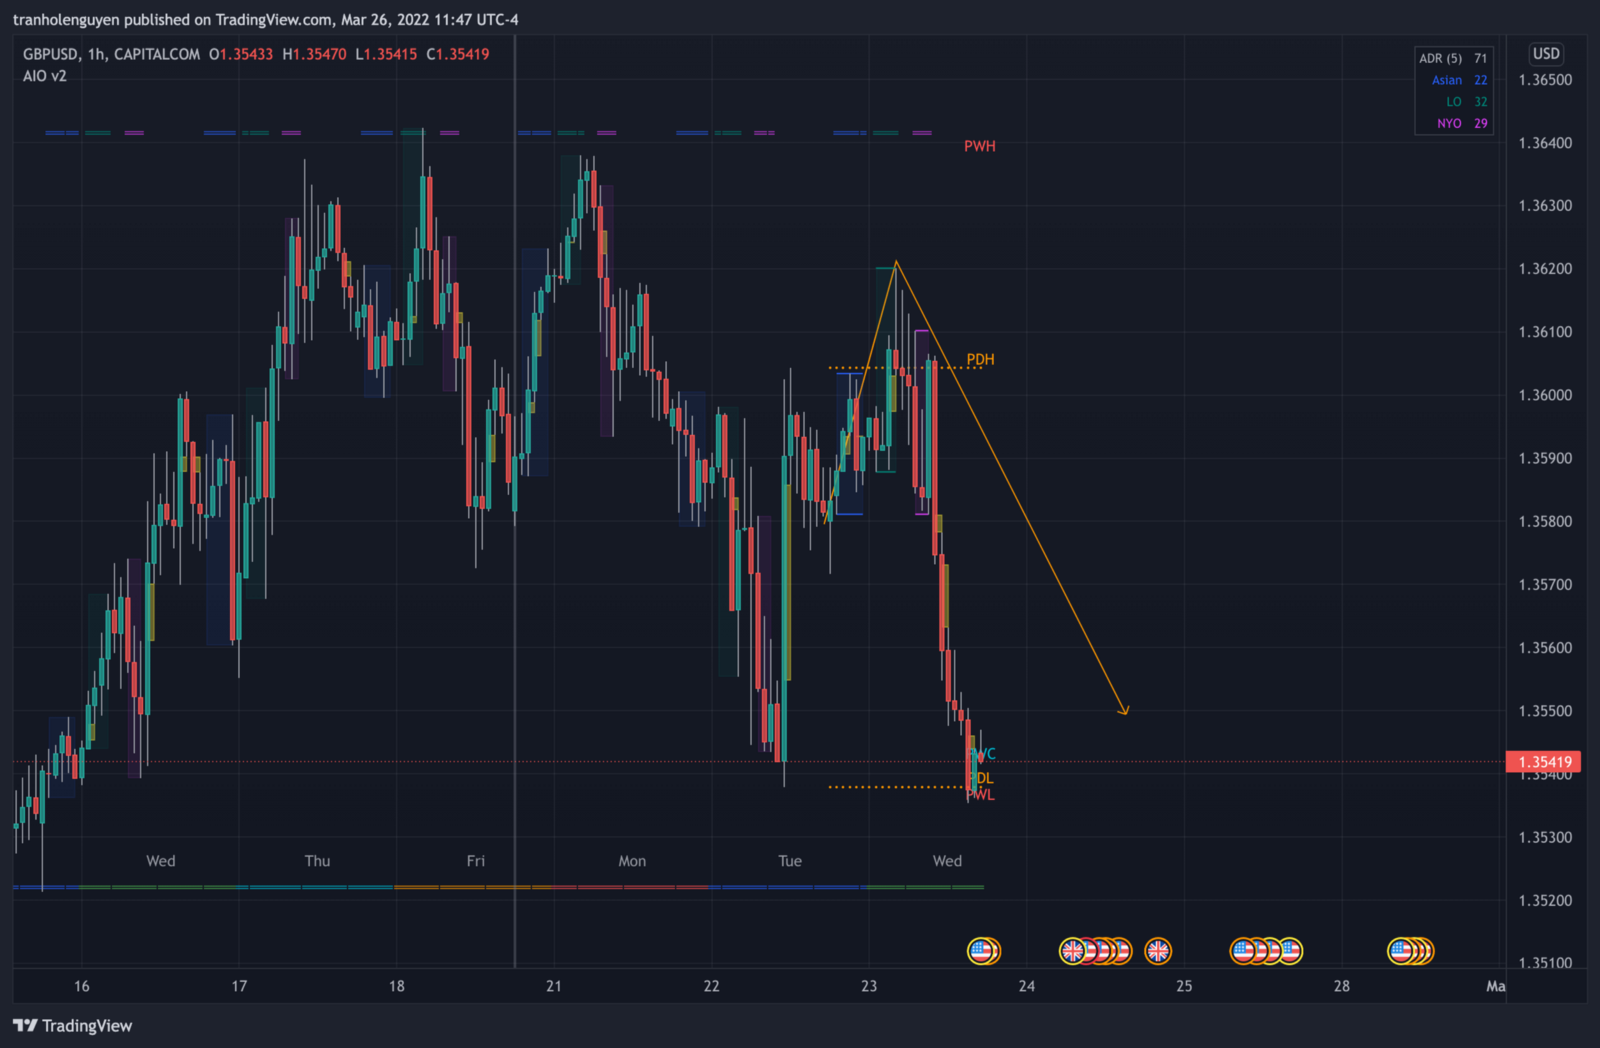
I personally love the previous week’s close level or in other words, the current week’s open level, I use this as a key support/resistance. For example: As long as the price is below the weekly open (previous week’s close), I continue selling until the high time frame key levels like order block, mitigation block, imbalance zone,... reached.
With each previous range data (day/week/month), we can choose to show or not equilibrium level to better detect premium/discount zone.
This indicator also has an option to show up to 2 price lines at a specific time, you can choose the price type (high/low/close/open) that you want to display. The default time values are:
Specific Time 1: 0:00. (New York Midnight Opening Price)
Specific Time 2: 8:30 am. (New York Session Opening Price)
—
Nguyen Tran